

 Admin Login
 Member Login
1Spot the signal
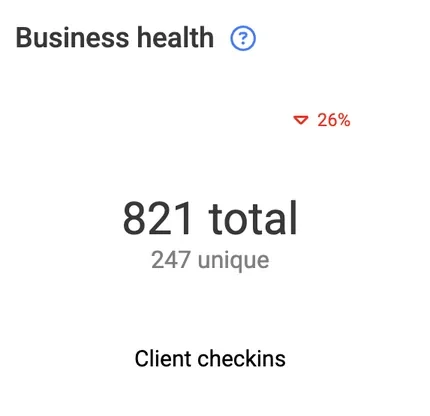
Check-ins are down 26% on the period before.
Check-ins, class utilization, sales, retention, revenue and team pay for any date range, compared with the period before. See what’s working and what isn’t without piecing it together from spreadsheets and other systems.
Pick a report to see how it answers a real question about your business. Every screen here is a real fitdegree report.
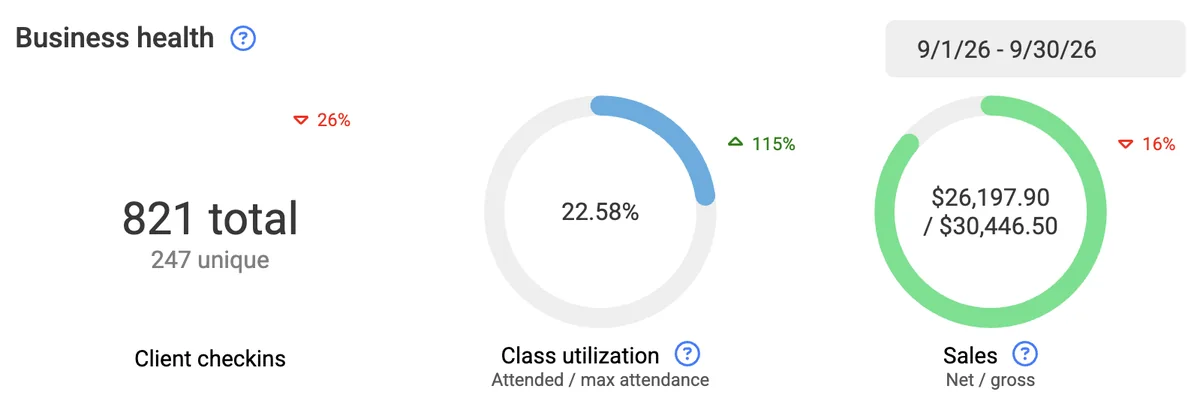
Business health compares the dates you choose with the period before, so you know in seconds whether check-ins, class utilization and sales are up or down.
Demonstration data. Names and figures are fictional.
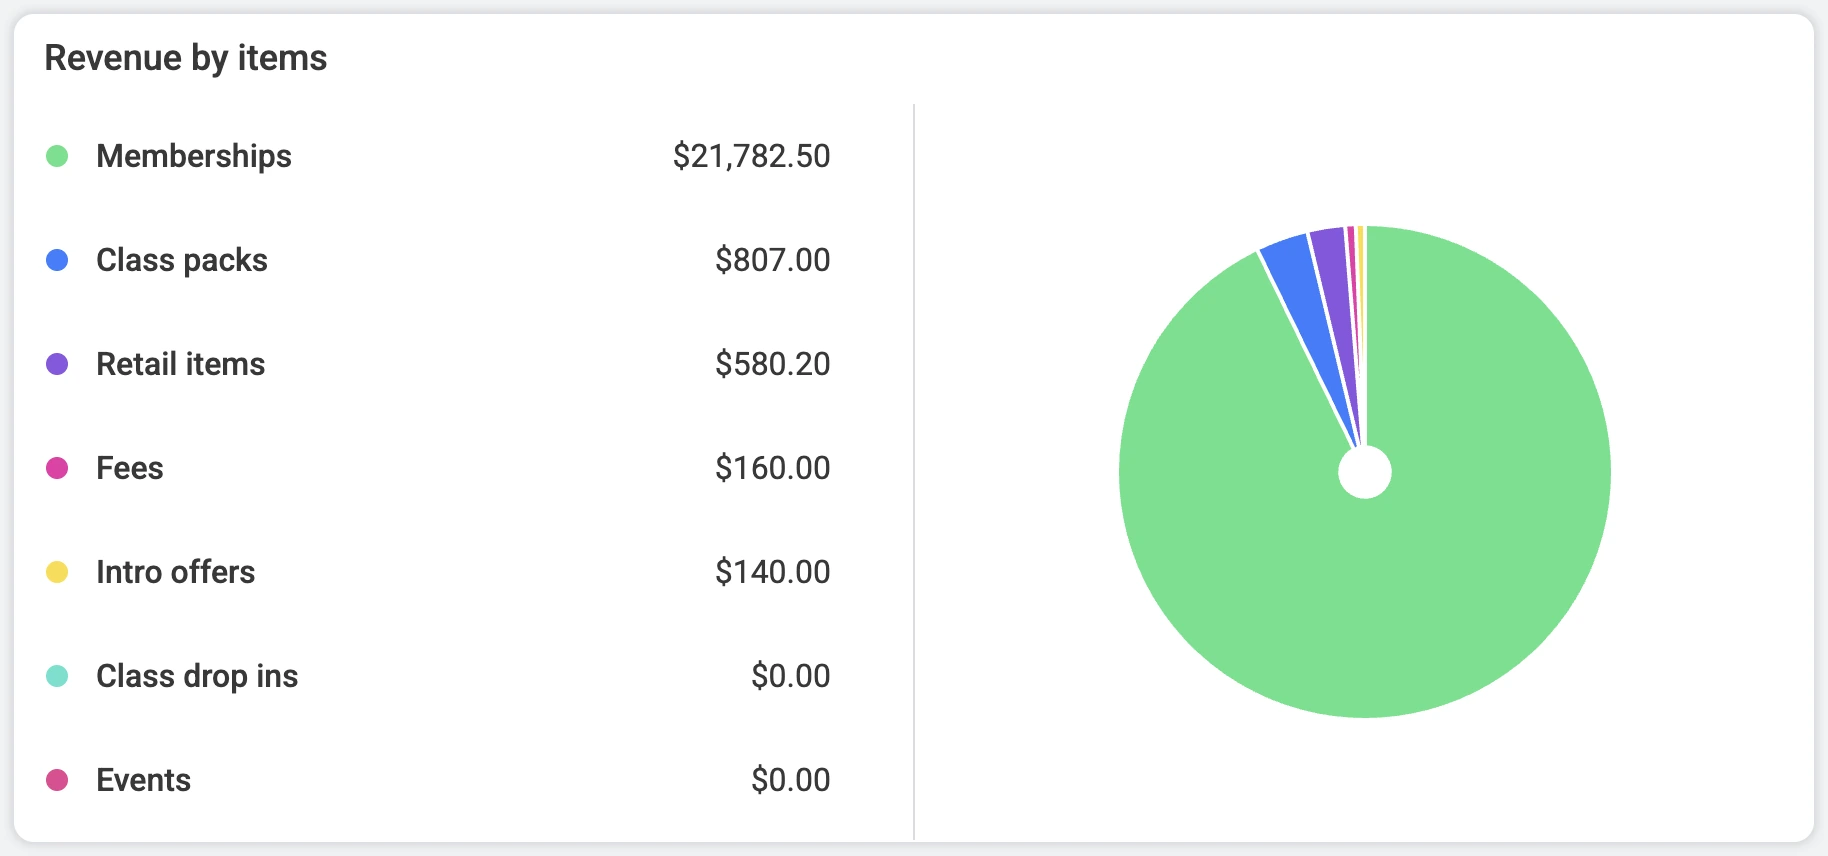
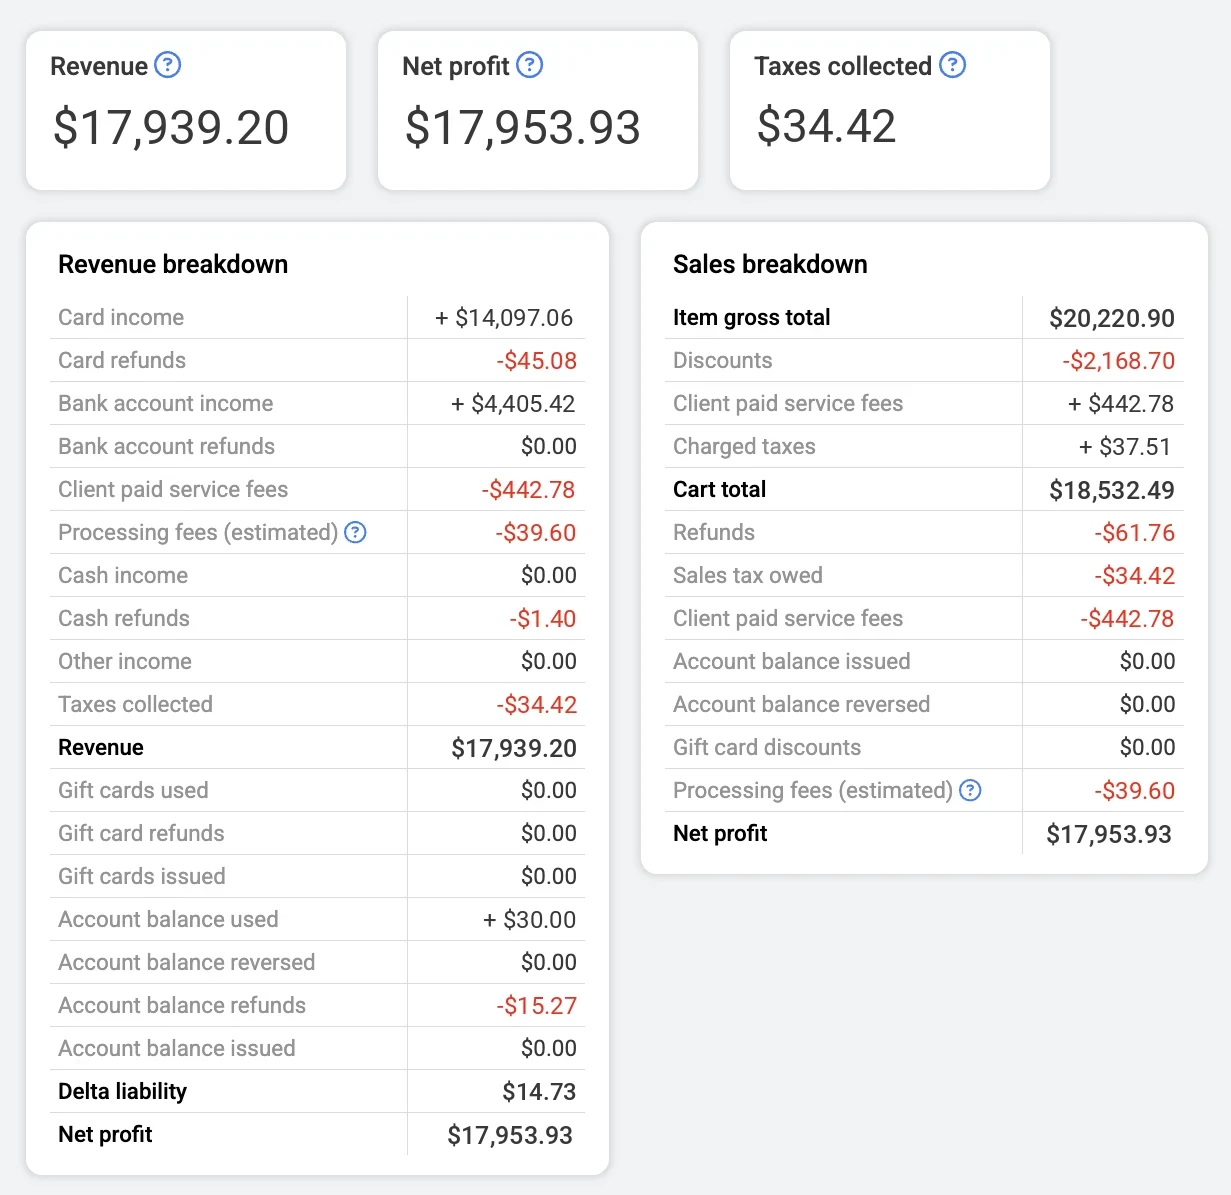
Revenue breaks income down by card, bank account and cash, with refunds, fees, taxes and net profit. Revenue by items shows what sold.
Demonstration data. Names and figures are fictional.
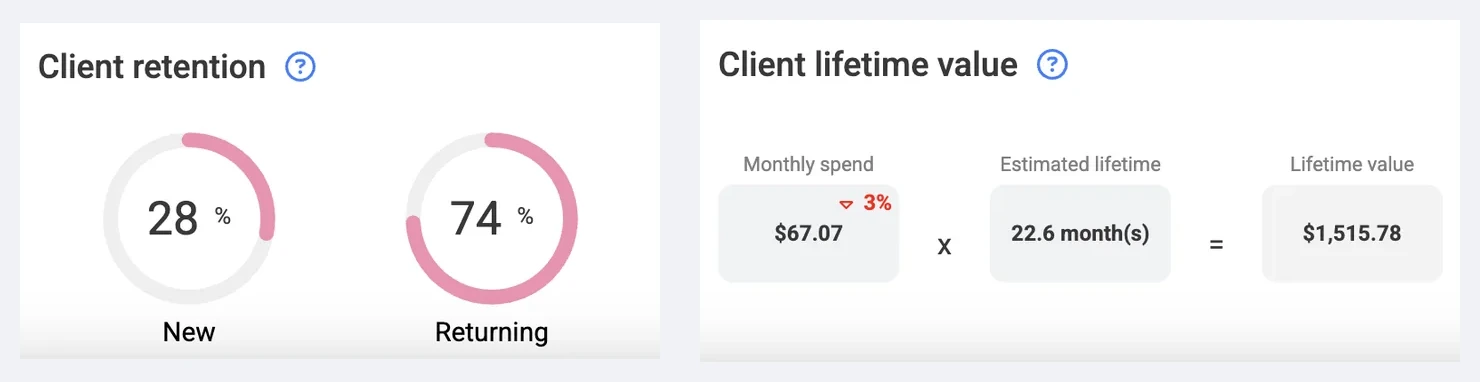
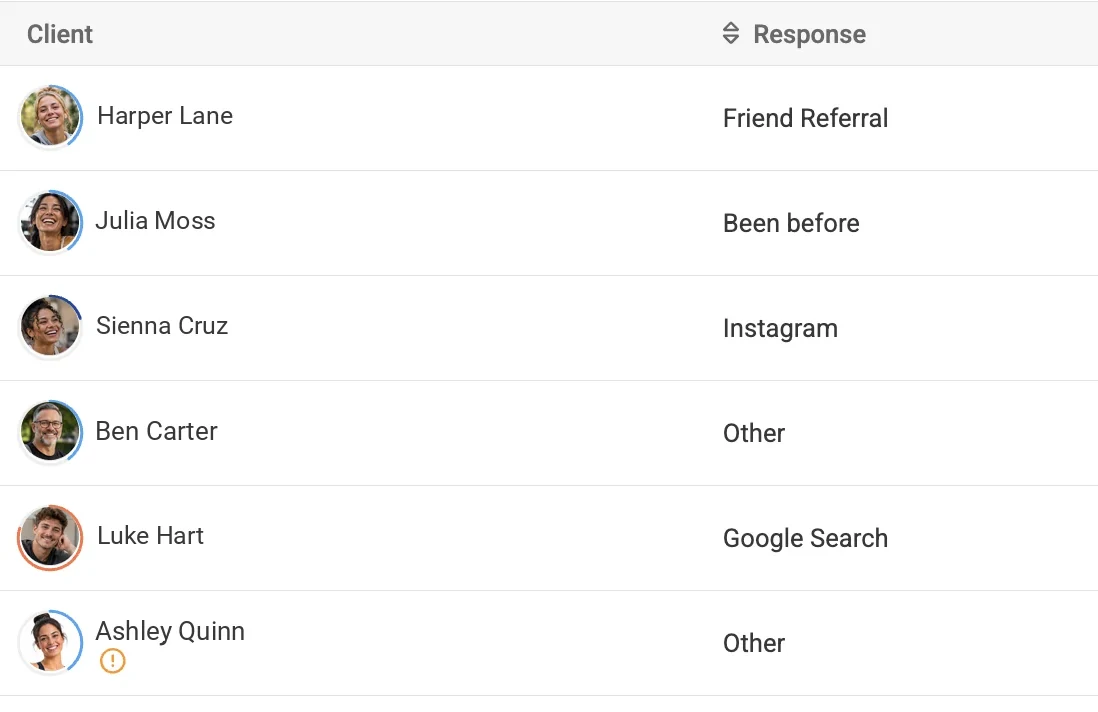
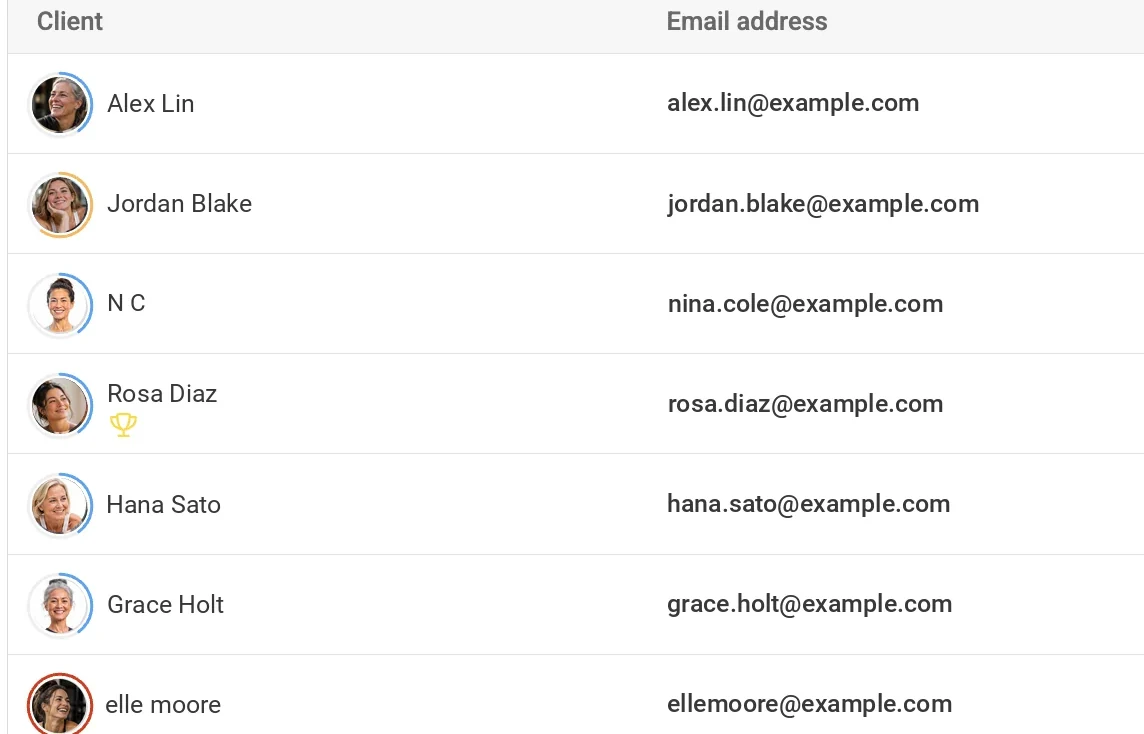
Client reports show where new clients come from, who has stopped coming and what you’ve sent them, so you can follow up with the right people.
Demonstration data. Names and figures are fictional.
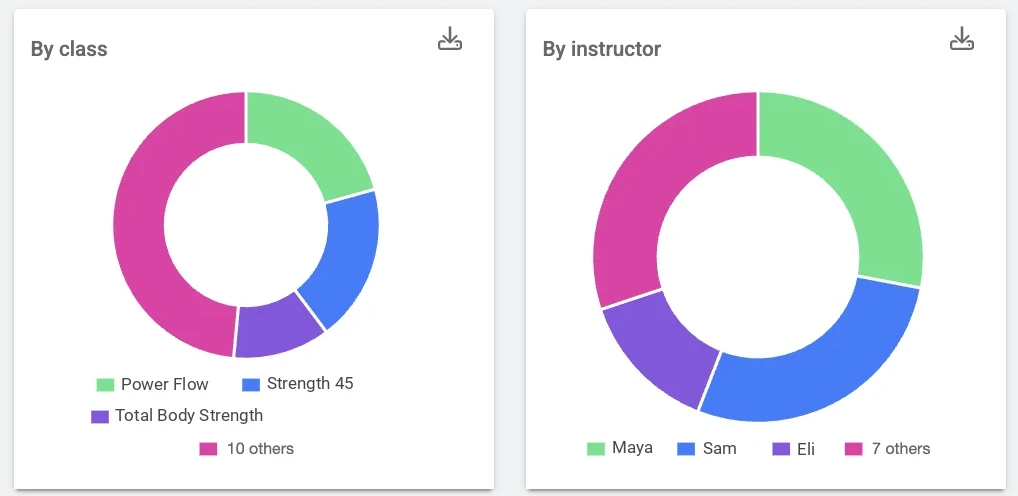
Popularity shows registrations by class, instructor, difficulty, gender and age for your lifetime, the last 90 days, a month or a week.
Demonstration data. Names and figures are fictional.

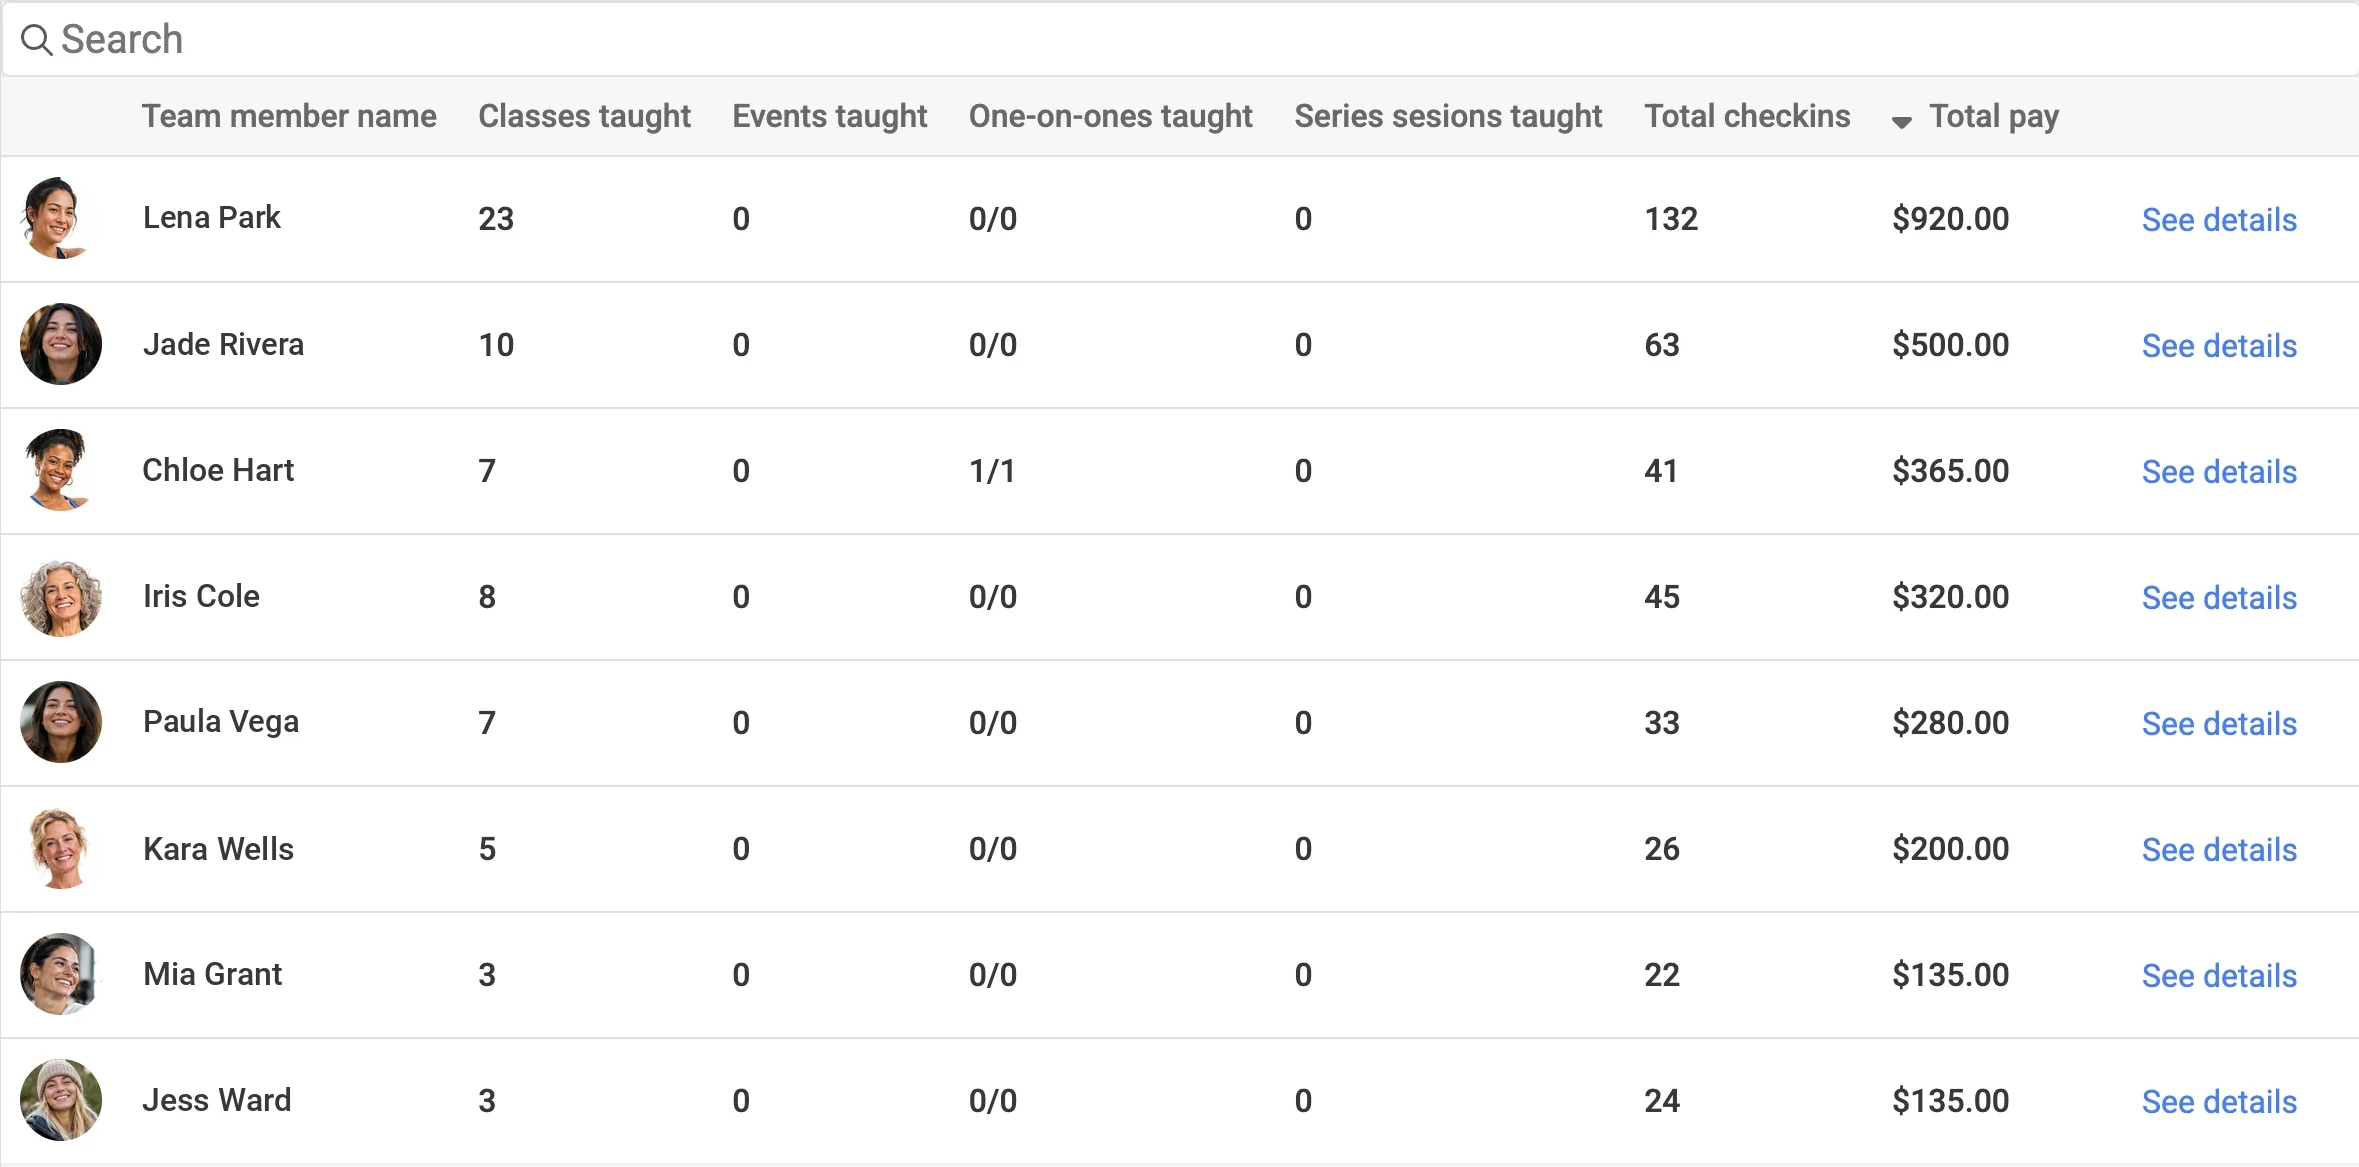
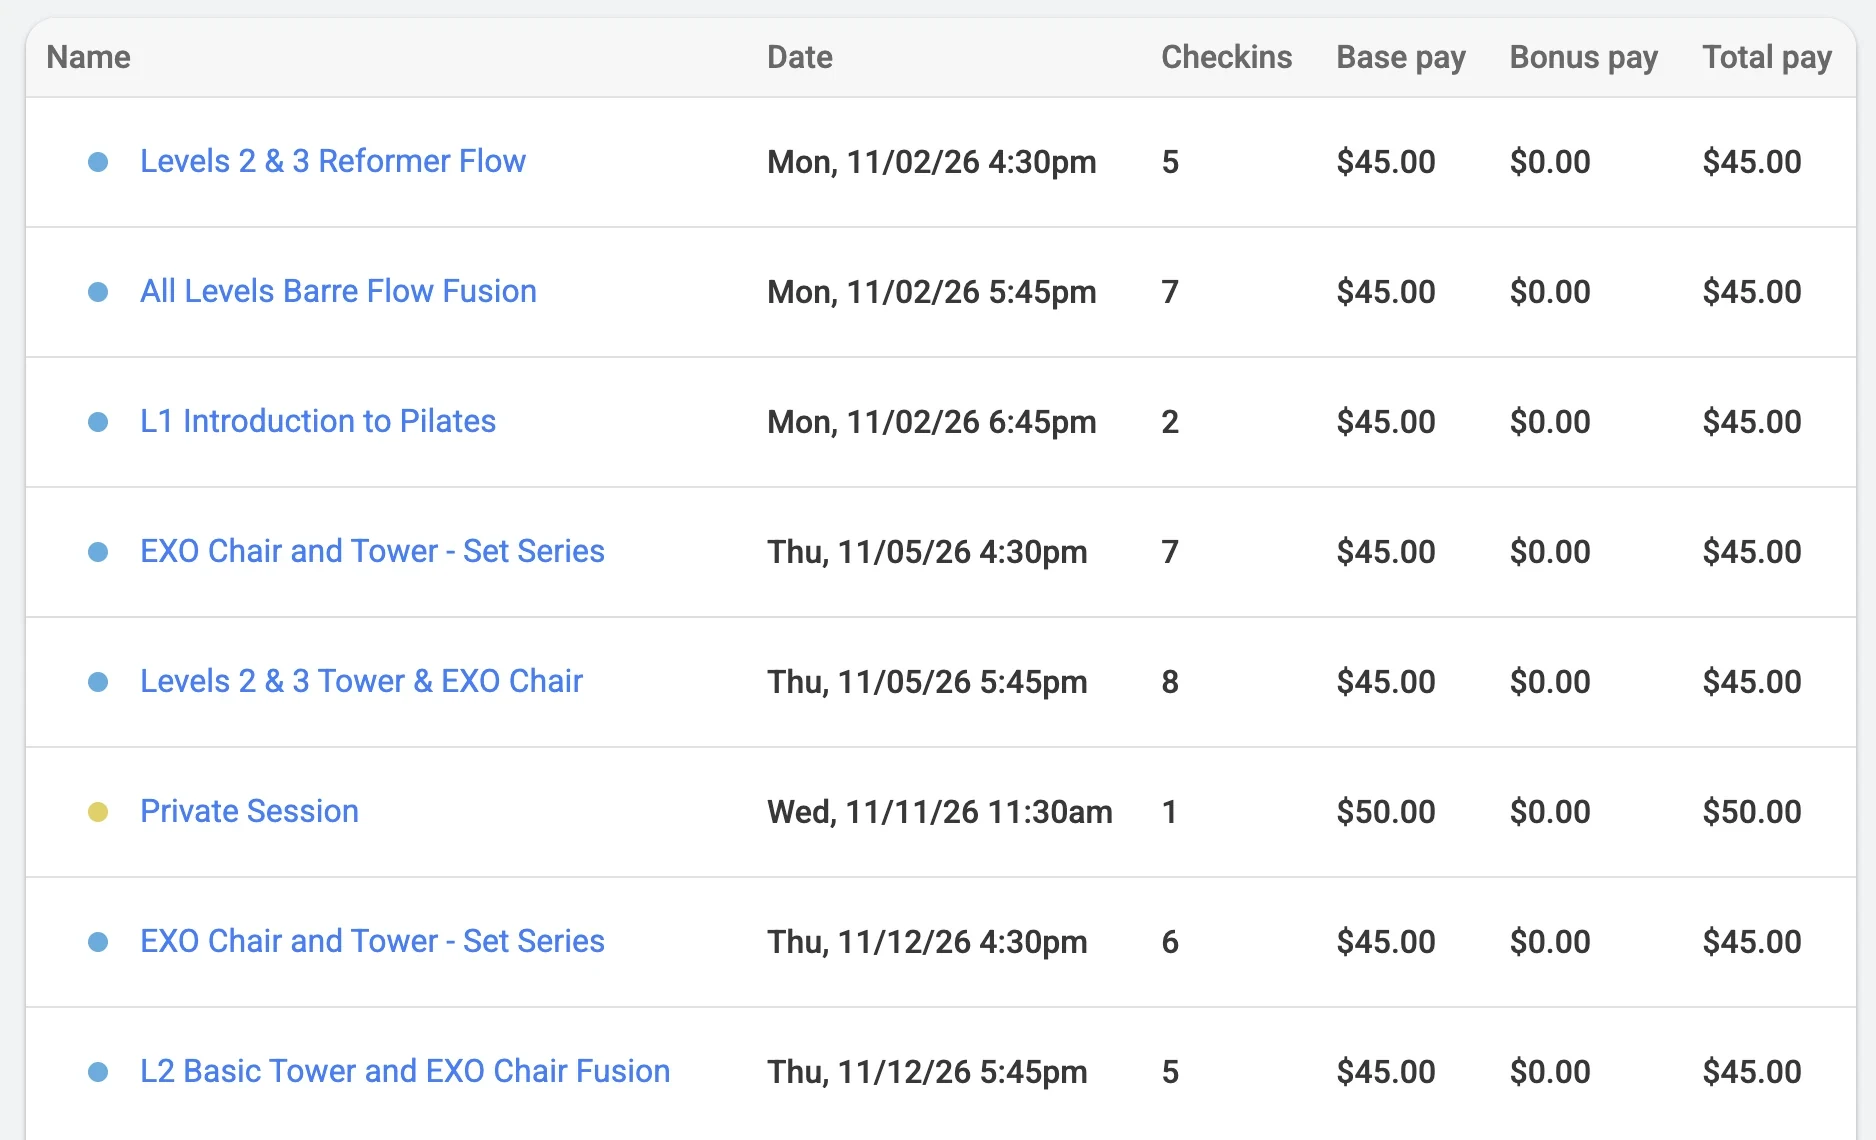
Follow each instructor’s classes, sessions and check-ins to their pay, using the pay rules you set. Use the totals for payroll in the system you already use.
Demonstration data. Names and figures are fictional.
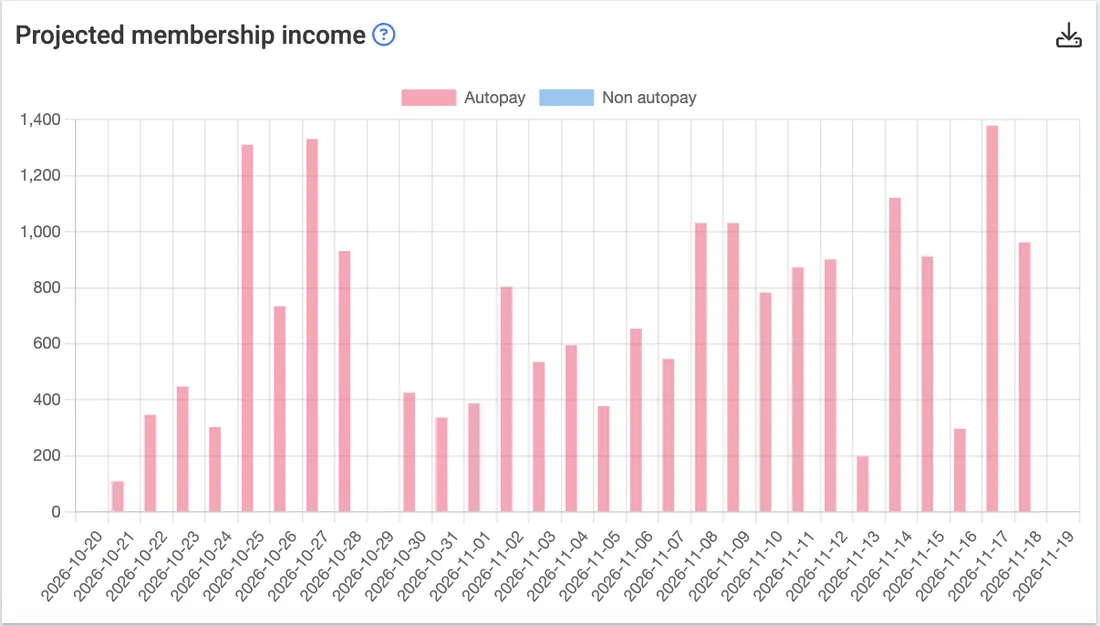
See who is on autopay and when each membership ends, then look ahead at the membership income that’s already on the way.
Demonstration data. Names and figures are fictional.
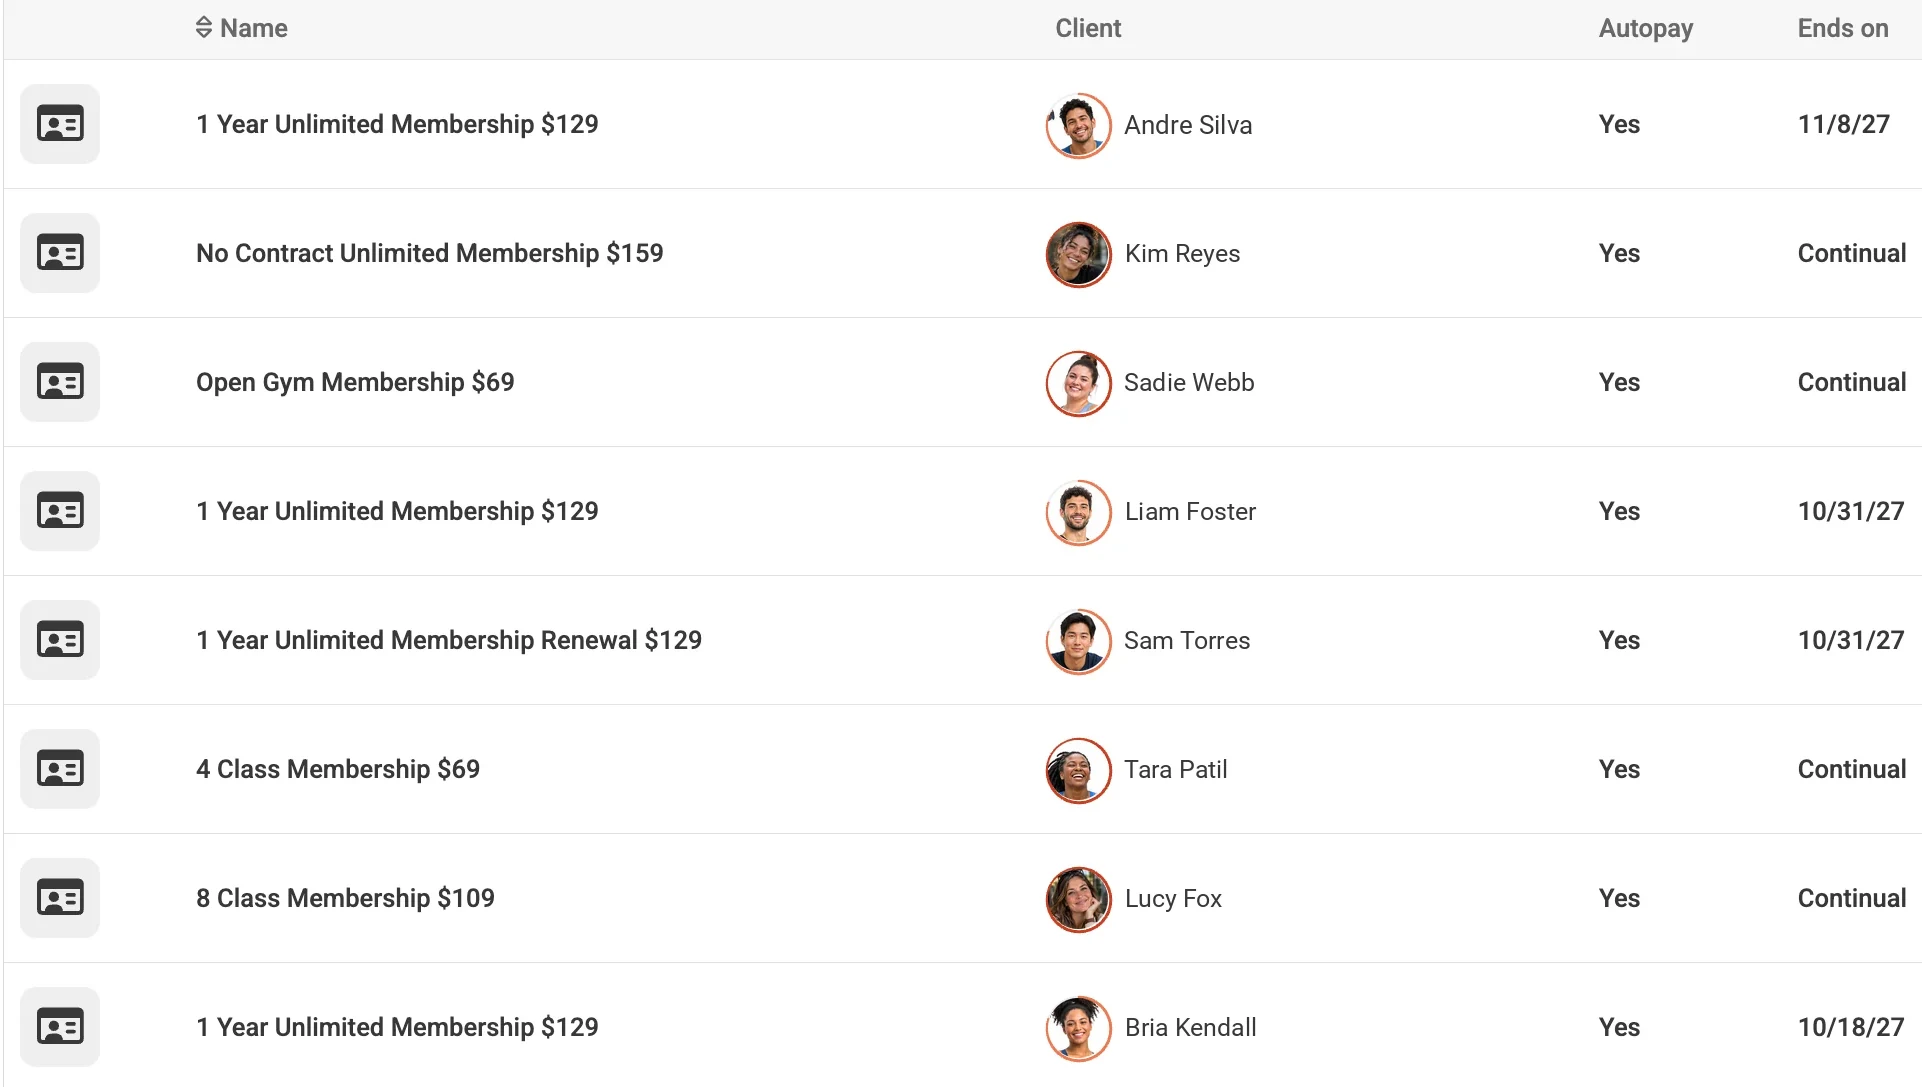
The Dashboard plus 37 reports. Pick a category to see what’s in it.
Report names as they appear in fitdegree Reports. Access reports require fitdegree Access.
Dashboard Favorite the reports you use most and they appear at the top of Reports.
A report is only useful if it changes what you do next. Here’s how owners go from a number to a decision.
1Spot the signal
Check-ins are down 26% on the period before.
2Understand it
Fewer visits usually start with a few regulars slipping. Routine breakers and Fading clients show exactly who they are.
3Take action
Reach out to those clients personally, or invite them back with an intro offer or class pack.
1Spot the signal
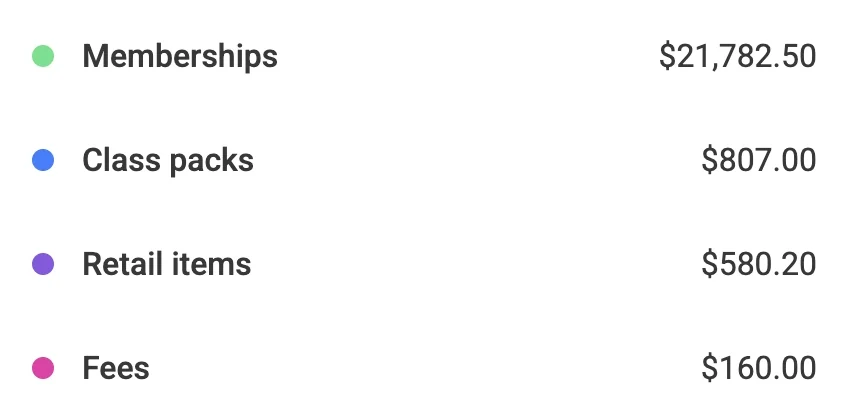
Memberships bring in $21,782.50. Class packs bring in $807.00.
2Understand it
Memberships are the business here. Protecting them matters more than anything else on the list.
3Take action
Check autopay in the Memberships report and look ahead with Projected membership income.
1Spot the signal
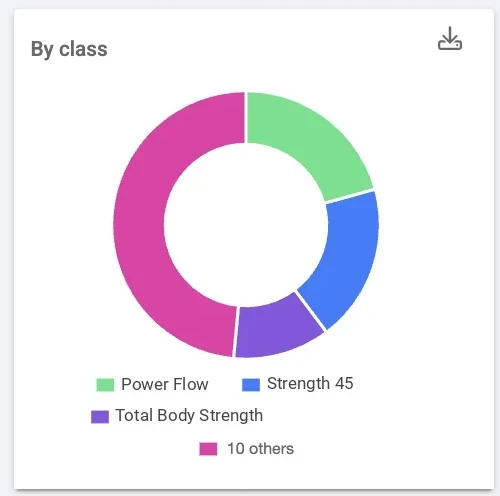
Power Flow, Strength 45 and Total Body Strength lead registrations.
2Understand it
Demand isn’t spread evenly. Popularity by class, instructor and time shows where it is.
3Take action
Add a time for the formats that fill, and rethink the ones that don’t, before you change the schedule.
1Spot the signal
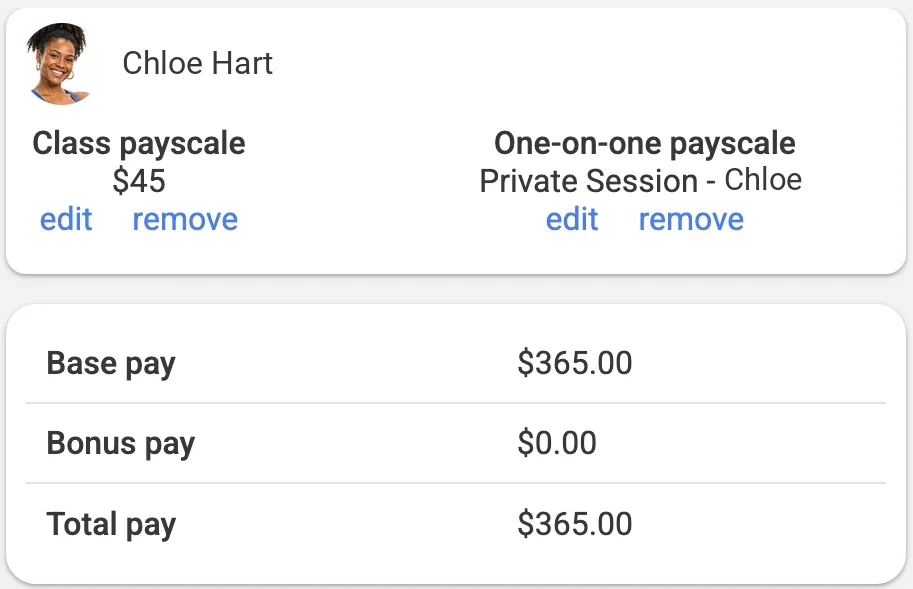
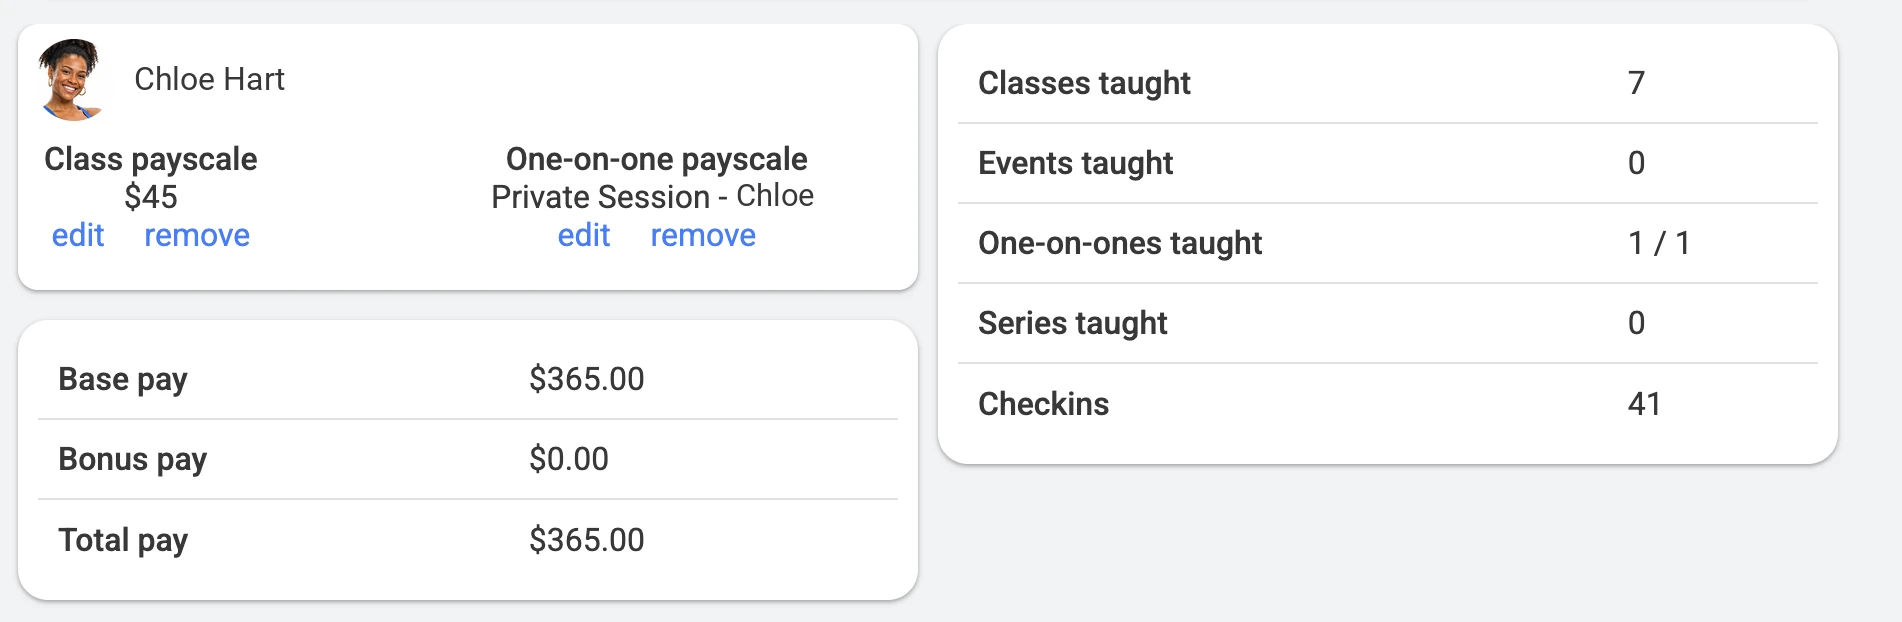
Chloe taught 7 classes and 1 one-on-one: $365.00.
2Understand it
Team member payout ties every dollar to a class or session and the pay rules you set.
3Take action
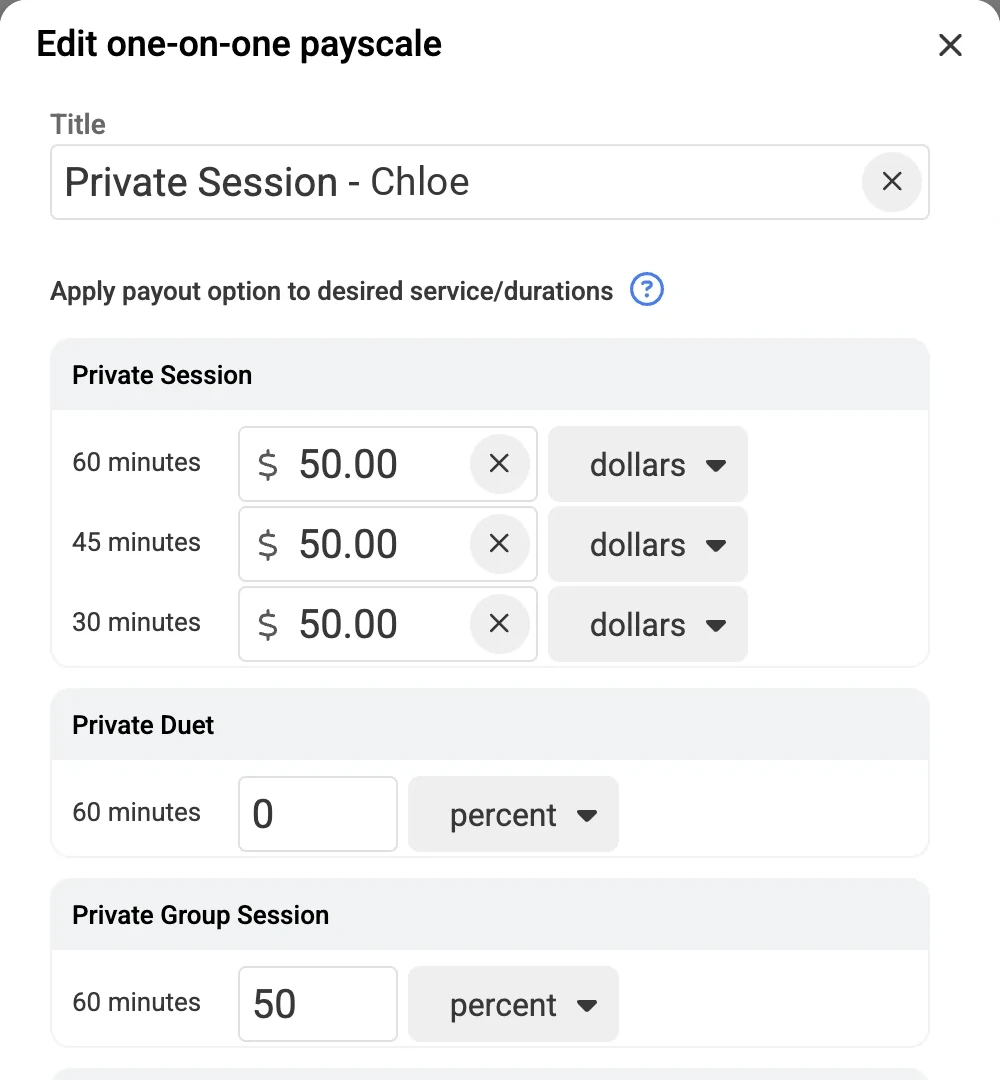
Review the totals and adjust a payscale if a rate is wrong, then run payroll the way you already do.
Examples use demonstration data. fitdegree shows the information; you and your team decide what to do.
Choosing software is a big decision. Here are a few things studio, gym, and club owners ask us most.
Reports includes the Dashboard plus 37 reports: Money (such as Revenue, Sales and Transactions), Clients (such as Fading clients, Routine breakers and How did you hear about us), Registrations (such as Popularity and Checkins), Access, Payment options (such as Memberships and Intro offers) and Business (such as Team member payout and Membership cancellations).
Yes. Business health compares the dates you choose with the period before, and reports such as Revenue, Popularity and Team member payout work for any date range.
It adds up the classes, events, one-on-ones and series sessions each team member taught in the date range, with check-ins, using the payscales you set. One-on-one payscales can differ by service and duration and can be a dollar amount or a percentage.
No. Team member payout calculates what each person earned and shows the details behind it. Use those totals in the payroll process you already have.
Many reports, such as Memberships, Sub requests and Projected membership income, include a download option to export the data.
Still have questions? Talk through your business with someone who knows the software.
Schedule a DemoSee your own reporting questions answered in a live demo.